Cracking the Cocoa Code with Data (Part 1): Does More Cocoa Mean Better Taste?
TL;DR
- Weak Link: More cocoa in chocolate doesn’t strongly affect how much people like it.
- Significant but Small: The connection we found is real but really tiny.
- Look Beyond Cocoa: There’s more to yummy chocolate than just high cocoa percentages.
Overview
A few of my friends belong to the exclusively dark chocolate camp. I always pondered whether darker, high-cocoa chocolate bars are truly superior in taste and cost more. It turns out the Manhattan Chocolate Society has been keeping records of their tastings since June 2007. They compare and discuss the qualities of fine chocolate to inspire higher quality product.
I am building on top of the high-level analysis on this popular dataset conducted by Lisa Chen and Alexey Samoylov by going both deeper into each variable and broader on the relationships between variables. This is the first part of many to come on Cracking the Cocoa Code with Data. Follow along link to my data analysis and visualization on colab
What You Will Learn
- Guide exploratory data analysis (EDA) with curiosity and a microscopic lens
- Structure the approach to encourage big picture thinking and avoid rabbit holes
- Define deliverables before you start
- Tap into your intuition to see beyond the data
Summary and Descriptive Statistics
- Total of 1692 chocolate bars
- “Ingredients” has 87 missing values
- Covers span of 17 years from the year 2006 to 2023
- A diverse range of taste profiles and descriptive terms used by the reviewers, e.g. 2,614+, may be related to the open-ended description in data collection. (More )
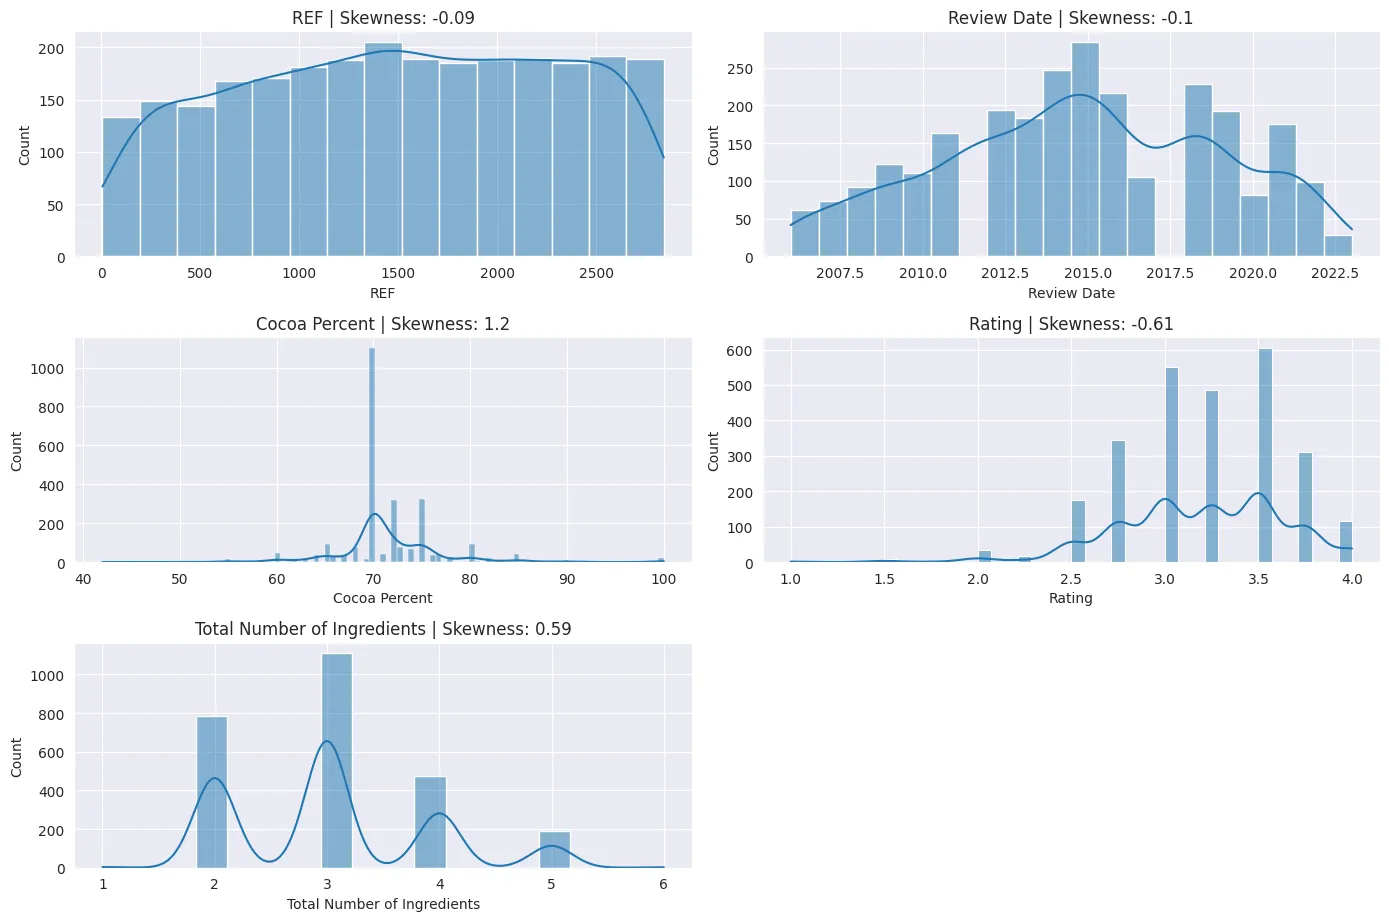
- Avg rating is 3.20 with a standard deviation of 0.44, indicating a moderate variation in the ratings
Missing Data, Distribution, and Potential Bias
Notably, some entries lack information on ingredients or specific bean origins, which could limit our analysis. The overall distribution of data points across countries and cocoa percentages may be poentially biased. Some regions have more data than others.
Limitations and Assumptions
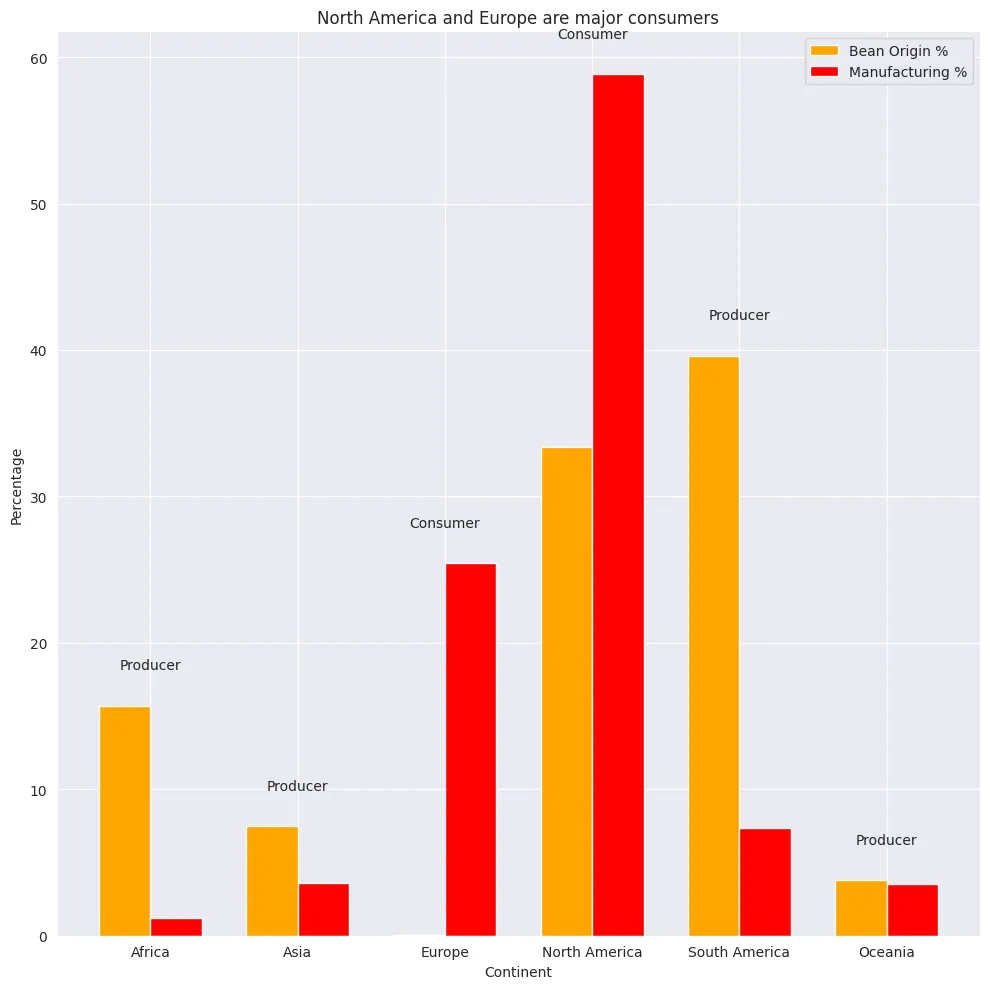
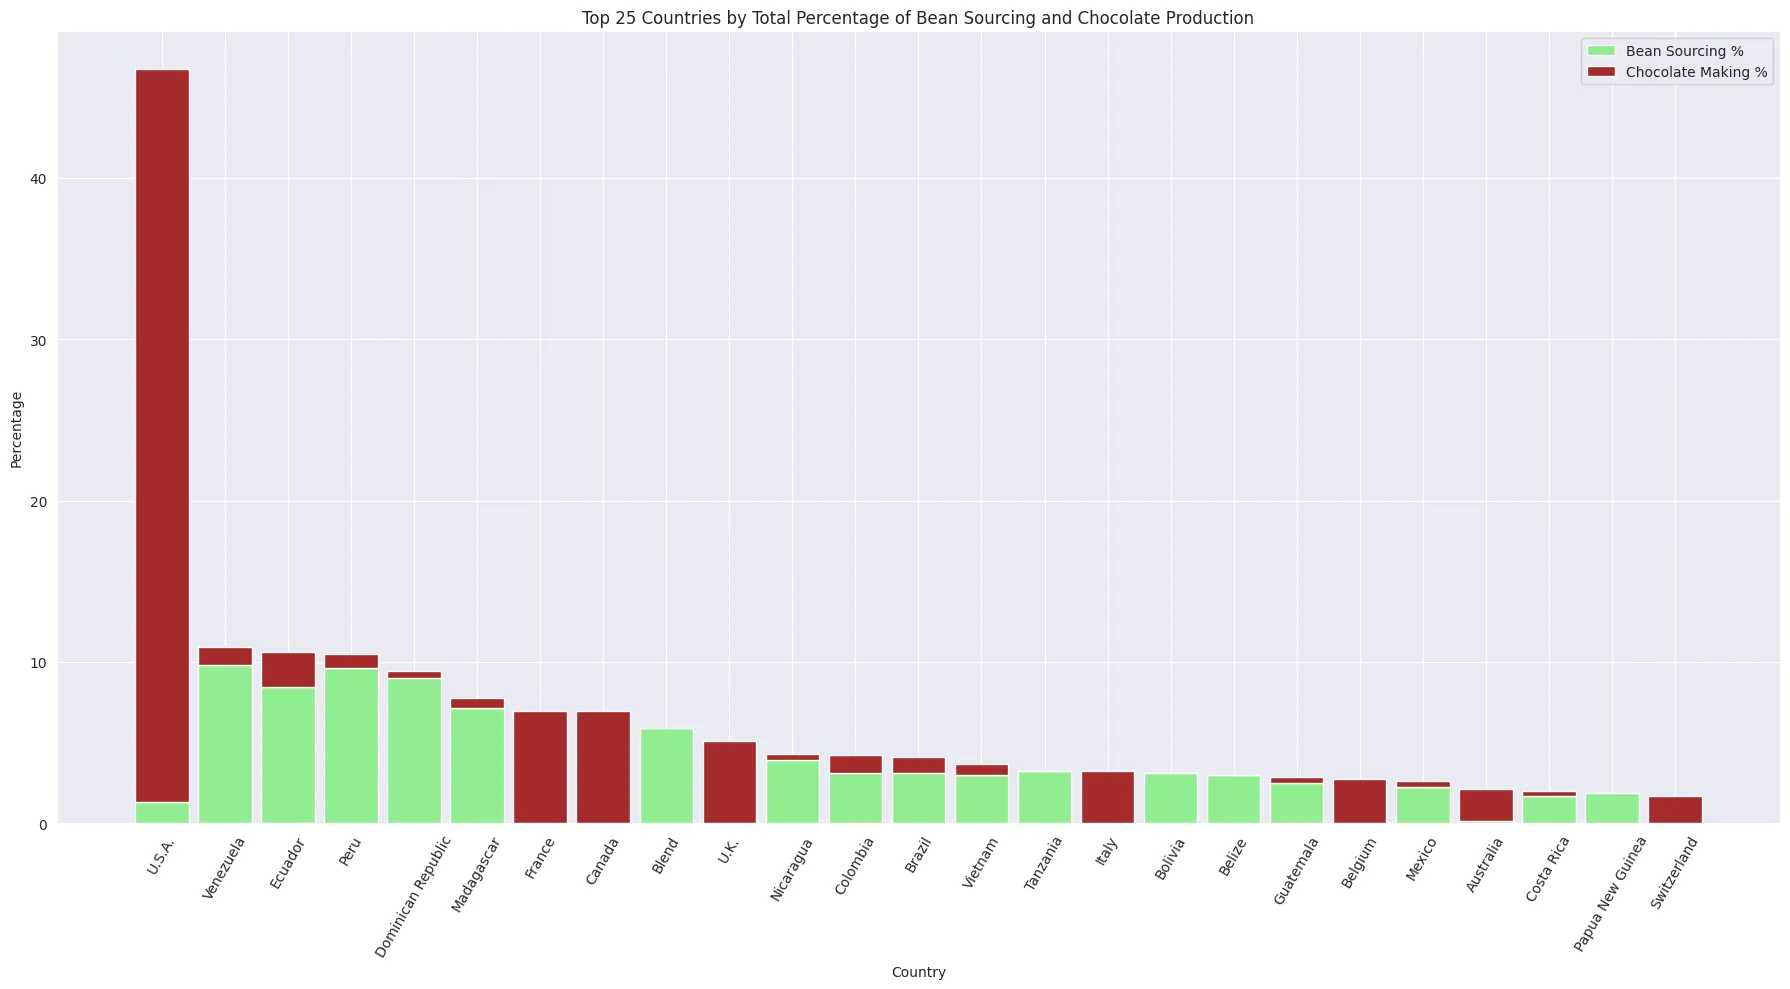
- Geographical Bias: The dataset might over-represent certain countries, both in terms of bean sourcing and chocolate production.
- Taste Subjectivity: Ratings are subjective, influenced by individual preferences, cultural tastes, and sampling of chocolate bars.
- Missing Data: Missing ingredients or specific origins may lead to gaps of understanding on taste.
Experiment
- Objective: To determine if there’s a link between cocoa content and taste ratings in chocolate.
- Method: We used the Pearson correlation coefficient, a statistical tool that measures the strength and direction of a relationship between two variables.
- Data Source: Manhattan Chocolate Society
What We Found
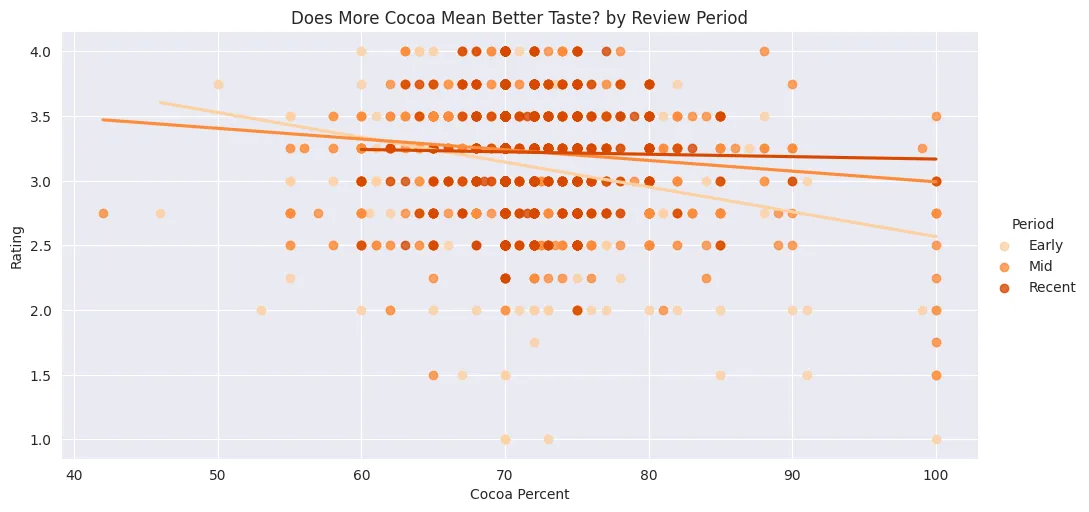
1. Higher cocoa content does not always equate to higher ratings
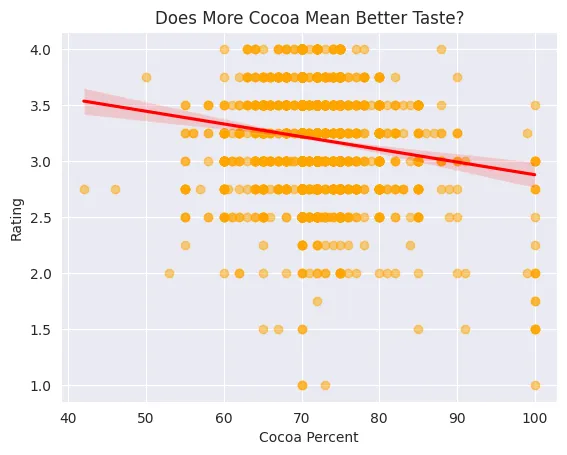
- Correlation Coefficient (-0.142): This indicates a slight, negative relationship between cocoa percentage and taste ratings. More cocoa doesn’t guarantee a better taste. The effect is quite minimal.
- P-Value (1.93×10^(-13)): This extremely small number confirms that our findings are statistically significant, meaning the slight relationship we observed isn’t due to random chance.
- A large number of chocolates have cocoa percentages around 70%, indicating a popular choice for chocolate makers. The positive skewness indicates that fewer chocolates have very high cocoa content.
2. 70% +/-2 is optimal amount of cocoa percent over time
- Over time, the average cocoa percentage in chocolates does not show a significant shift for every 6 years increment, staying around 70%.

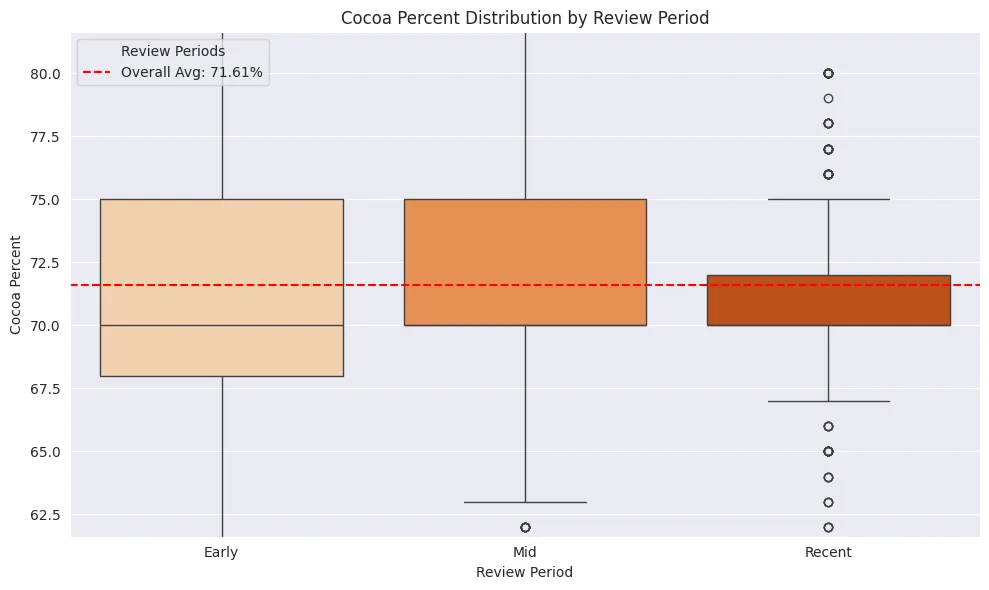
- The box plots indicate that while there is some variation in cocoa percentages, the overall amount remains steady at 71.6%.
What Does This Mean for Chocolate Lovers?
The data suggests that while there’s a minor trend where higher cocoa might not equate to higher enjoyment, it’s not strong enough to make a definitive rule. It’s akin to discovering a tiny detail that’s interesting but not game-changing.
So, What Should Chocolate Makers Do?
For those crafting chocolate or those who love indulging in it, here’s the takeaway:
- Look Beyond Cocoa: The percentage of cocoa is just one factor. The origin of the beans, the manufacturing process, and additional ingredients significantly influence the final taste.
- Diverse Tastes: Recognize that taste preferences vary widely. What delights one person might not impress another, regardless of cocoa content.
Key Takeaway for The Data-Minded
-
Findings: The Pearson correlation coefficient of approximately -0.142, along with a statistically significant p-value (1.93×10^13), indicates a weak but statistically significant negative relationship between cocoa percentage and chocolate rating. This suggests that higher cocoa percentages are slightly associated with lower ratings, but the overall effect is very small.
-
Interpretation: While the statistical analysis reveals a significant relationship, the practical impact of cocoa percentage on chocolate rating appears to be minimal. This implies that factors other than cocoa percentage are more influential in determining the overall rating of chocolate bars.
-
Recommendation: Stakeholders, such as chocolatiers and chocolate manufacturers, should consider other attributes alongside cocoa percentage when aiming to improve the quality and consumer appeal of their products. These may include the origin of cocoa beans, processing techniques, additional ingredients, and flavor profiles. We will dive into the impact of geography on chocolate next.
Next: Impact of Geography
A sneak peek by continent and countries.